Analyze user experience, application performance and process compliance with io.Insights
io.Insights allows operational, compliance and risk teams to capture user behavior as they navigate within and between io.-enabled applications. Gain transparency into user journey with powerful, data-driven insights.
Understand how often applications are used and the duration of their usage, driving better decision making on future investments.
Identify productivity opportunities by analyzing employee performance, understanding work patterns and activity levels.
Monitor machine health and resource consumption to identify potential problems before they affect your users.
Clients see answers to questions such as: Which user journeys generate the best outcomes? Which users need training? What applications can I decommission?
Benefits of io.Insights
- Analyze user experience
- Monitor compliance
- IT prioritization
- Track system health
- Identify and track best practices
Quickly identify applications for potential consolidation, integration or removal. Gain insight into user effectiveness and identify opportunities for (re-)training.
Prove adherence to process in regulated industries. Provide evidence to show compliance (or non-compliance).
Identify workflow bottlenecks and assess cost/benefit of change. Target investment based upon actual usage.
Monitor machine utilization and performance. Capture evidence for environment refresh/replacement programs.
Improve business outcomes by measuring performance against best practice. Train/re-train staff to improve outcomes.
How it works
OpenTelemetry is an observability framework designed to create and manage telemetry data using a universal, open-source approach. io.Insights follows OpenTelemetry standards for all published data.
You may currently have tools in place to collect telemetry data within the software or application you currently provide, but interop.io technology introduces new behavior that extends between the boundaries of individual applications.
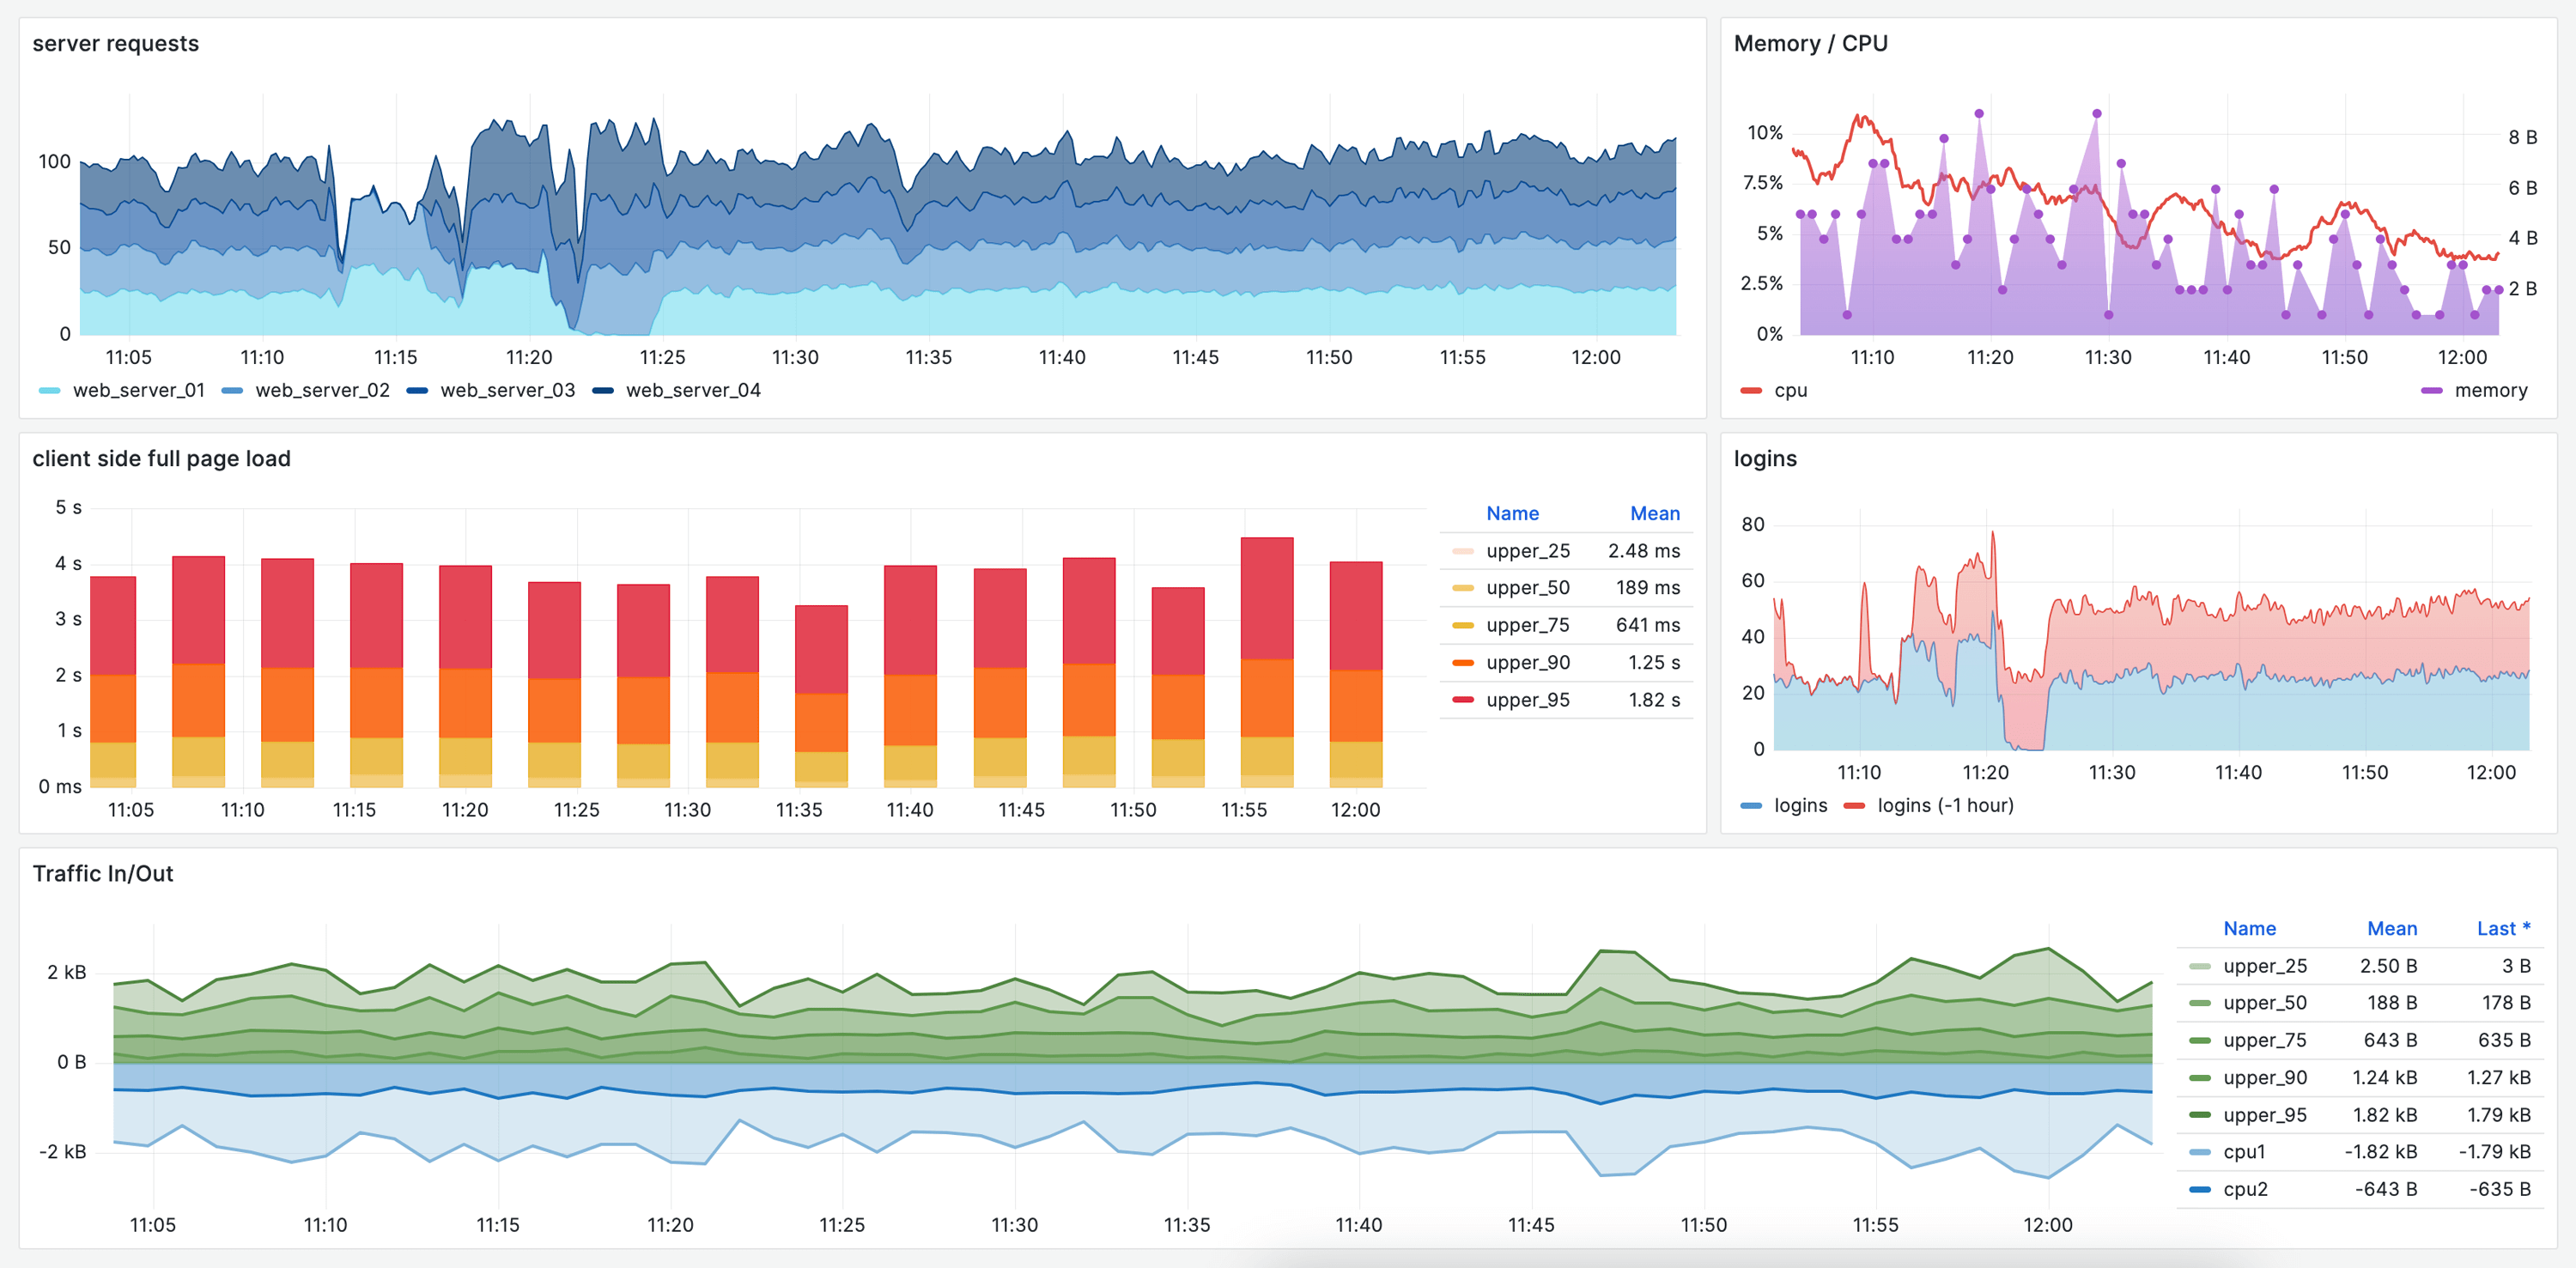
Because io.Insights follows OpenTelemetry standards, clients can easily incorporate data into existing tools and platforms, whether it’s Prometheus for storage or Grafana for visualization.
Collect –>
Io.Insights renders all telemetry data, providing it to clients following OpenTelemetry standards.
Store –>
Clients manage data easily with in-house or open-source back-ends such as Prometheus.
Visualize –>
Clients can create dashboards using open-source software such as Grafana or with help from interop.io Professional Services.

Sample client dashboard
Bring data sets to life with interop.io Professional Services
Did you know interop.io Professional Services can help your team build bespoke dashboards? Visualize your data to see how users work across their current applications – app usage, focus time, feature clicks and workflows to inform current (and future!) state analysis requirements.
See how professional services can help